



Safety Is a Financial Variable.
Most CFOs Are Still Treating It as a Fixed Cost.
Buy Action-cards® in our webshop now:
Safety has long been treated as a compliance obligation: a cost to be budgeted, documented, and held flat year on year.
But a closer look at how safety investment is actually structured — and what it delivers — often reveals a significant gap between what companies spend and what they get back. This piece makes the case for Action-cards® and AC-Analytics as financially material decisions.

The real cost of a safety incident
Direct costs — treatment, compensation, and fines — are only part of the picture. According to the National Safety Council’s 2024 Injury Facts, the average direct cost per medically consulted workplace injury in the US is $48,000.1 That figure spans an enormous range: a minor cut and a serious crush injury are both “medically consulted injuries.” Some incidents cost far less. Serious ones cost considerably more.
(All figures in USD.)
Where your organisation sits: LTIR and TRIR
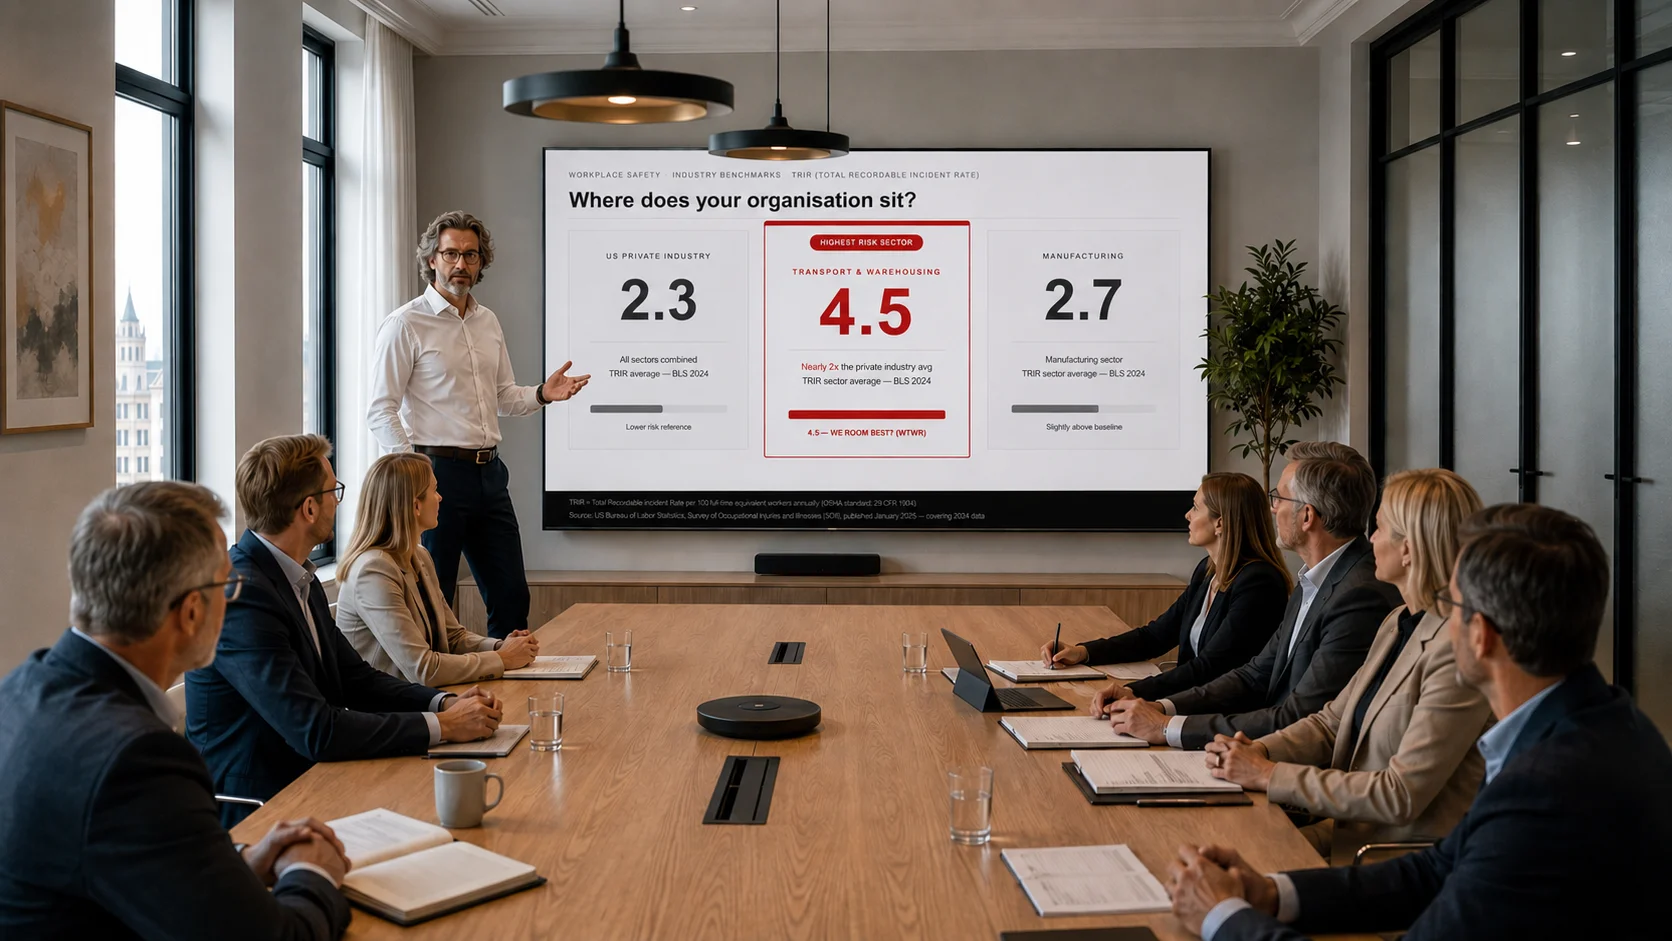
Two metrics determine how insurers, regulators, and ESG-conscious lenders assess your safety performance. Lost Time Injury Rate (LTIR) tracks incidents causing missed workdays. Total Recordable Incident Rate (TRIR) captures all recordable injuries and runs higher. Both are calculated per 100 FTE workers annually — the OSHA standard.2
US private industry
2.3
TRIR average (BLS, 2024)
Transport & warehousing
4.5
TRIR sector average (BLS, 2024)
2.7
TRIR sector average (BLS, 2024)
A deteriorating TRIR translates directly into higher insurance renewal costs. Under CSRD and GRI frameworks, safety KPIs feed ESG ratings that influence access to financing. An above-average TRIR can also disqualify a company from certain procurement processes. Independent risk assessments by our consultancy have, in some cases, revealed incident rates running five to seven times above national sector averages — gaps large enough to be financially significant even accounting for data uncertainty.3

In most of the organisations we visit, the safety budget has been approved year after year without anyone asking a simple question: is the training we paid for last year still there — in the heads and hands of our people — when it matters? In our experience, the honest answer is usually uncomfortable.
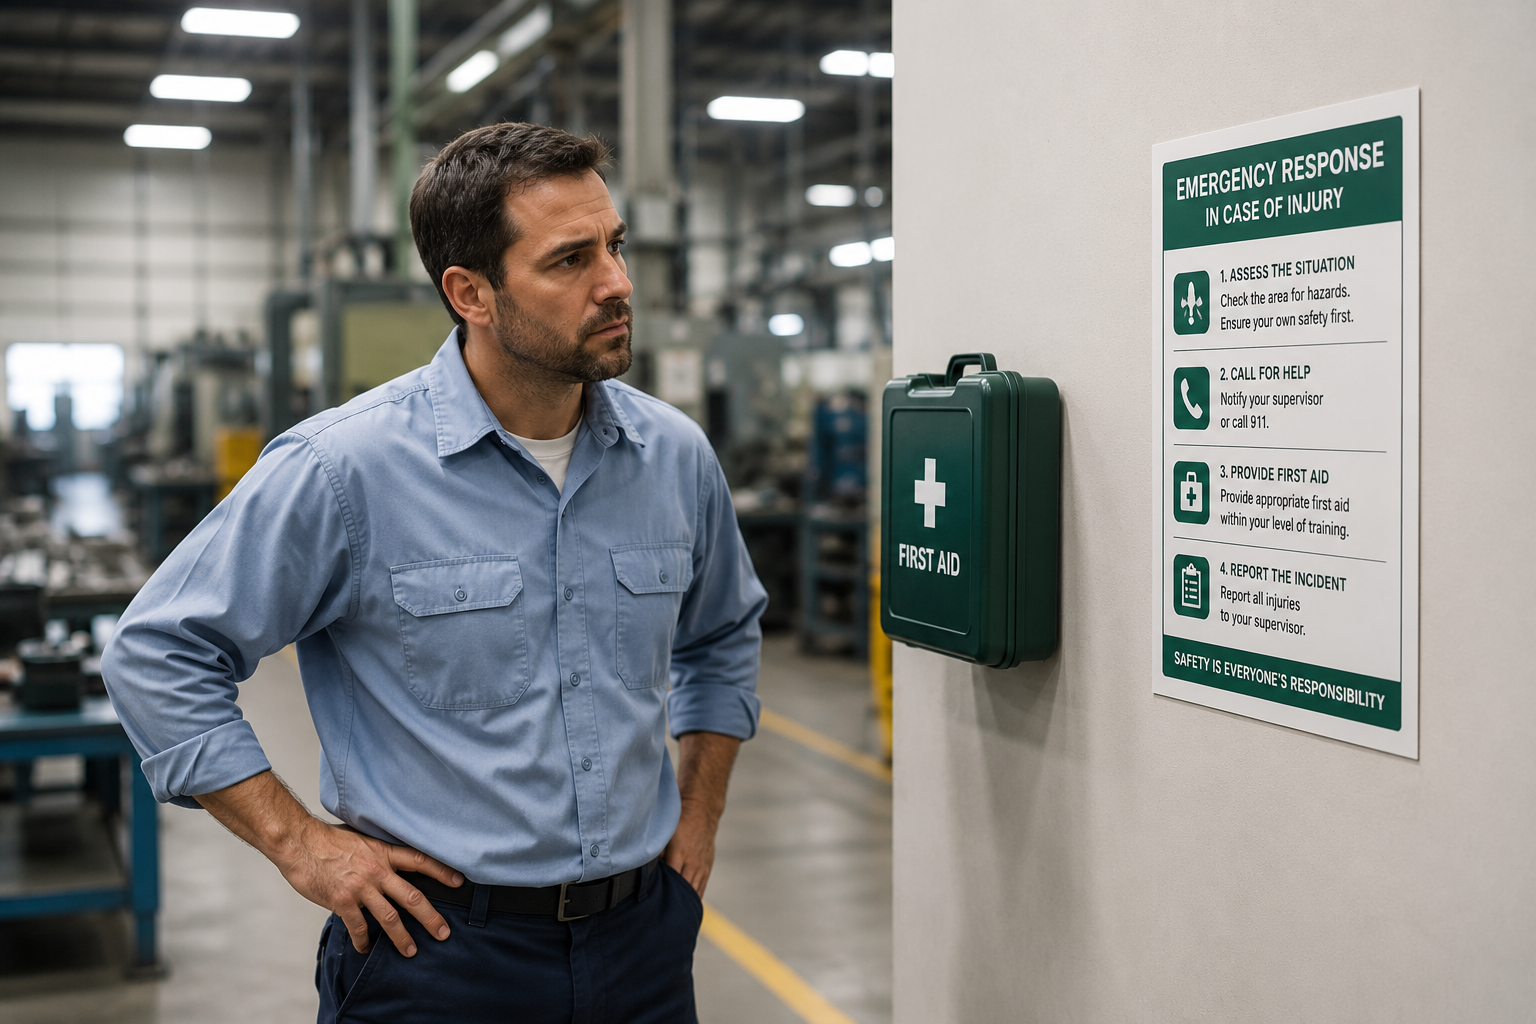
The depreciation problem nobody is measuring
Safety training is purchased as an annual event. The course is delivered, the record is filed, and the box is ticked. What is rarely measured is how quickly that investment loses its value.
Emergency response skills decay faster than most people assume. A study of 257 paid workplace first responders across industrial and service sites found measurable decline in practical skills as early as 30 days after training — and the authors recommend refreshing as often as every 90 days.6
This is not a matter of degrees. Among nurses, 63% passed a practical BLS assessment at 3 months and 58% at 12 months, while only 30% passed ACLS at 3 months — falling to 14% at 12 months. 7
Action-cards® address this through continuous micro-reinforcement covering the full spectrum of workplace emergencies — cardiac arrest, fire response, chemical exposure, trauma, respiratory emergencies, and more. Not just CPR. Every emergency your people might actually face.
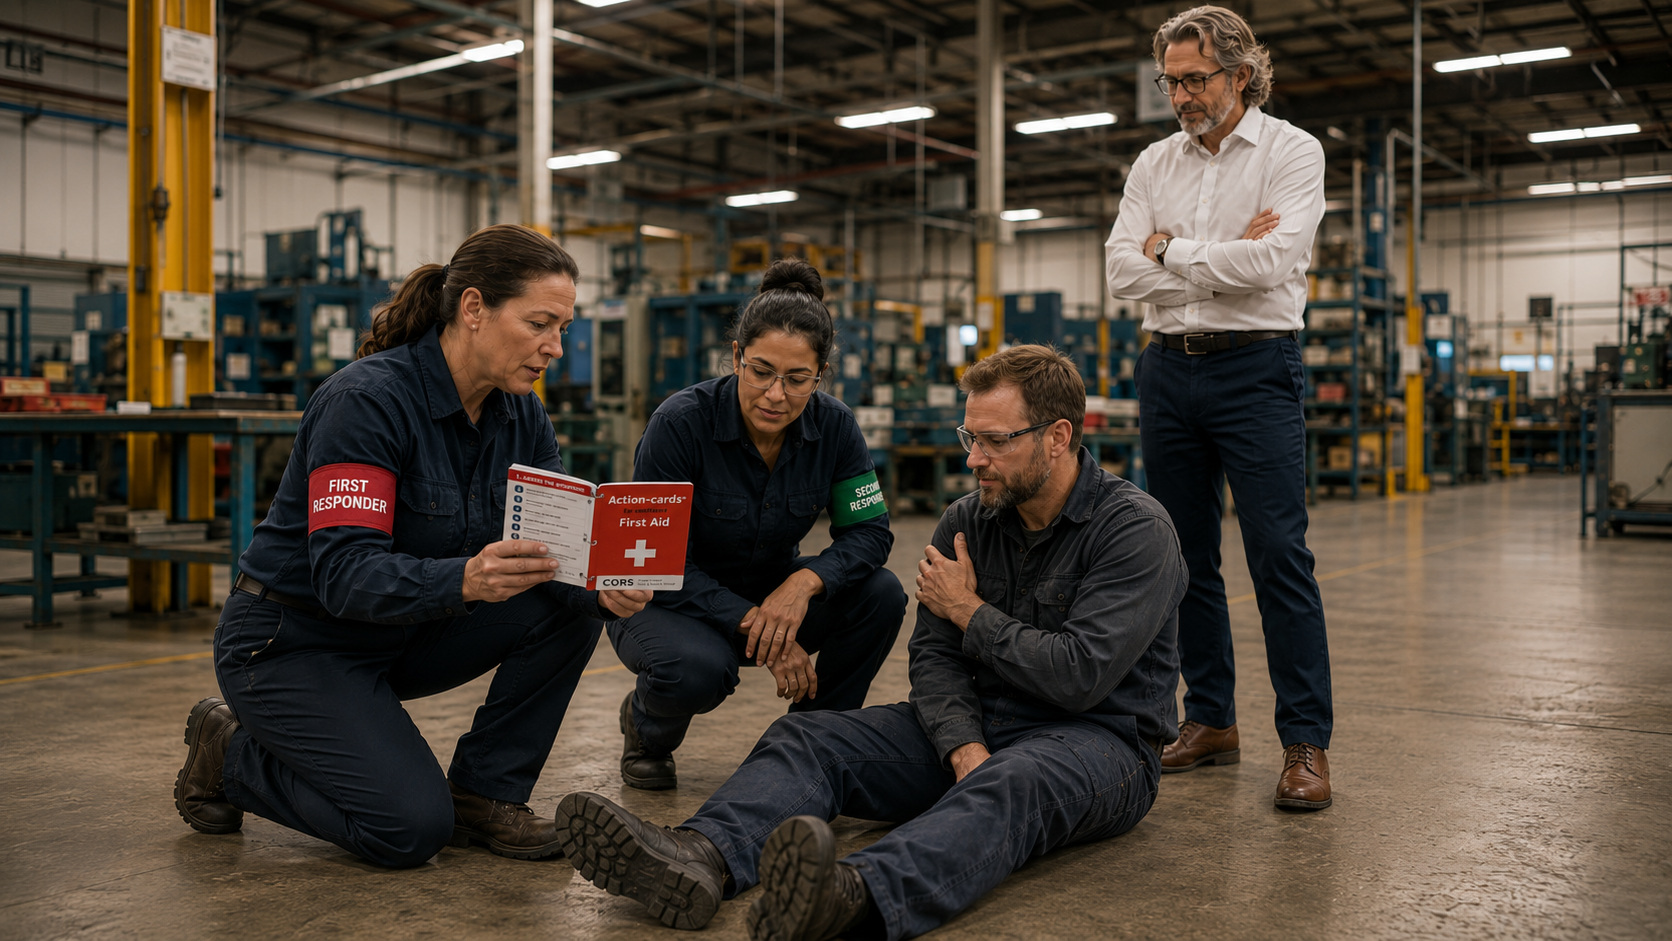
No production time lost
Micro-sessions of 10 to 20 minutes can be attached to existing morning briefings or Monday meetings — no additional time out of production required. At a total employment cost of approximately $46 per hour (BLS, Q2 2025), a single 6-hour annual certification course costs around $276 per employee in lost production time alone — approximately $83,000 for 300 employees, before a trainer has been paid.4 Under the Action-cards® model, that figure is effectively close to zero.
A business case has two sides: what there is to gain — and what it costs to get it. Here are both.
WORKED EXAMPLE · BASED ON DOCUMENTED BENCHMARKS
What is at stake in a 300-person operation?
The figures below show what fewer workplace incidents and reclaimed training time are worth in cash terms for a typical industrial operation. They are not guarantees — actual outcomes depend on starting conditions, implementation quality, and workforce profile. But for a company matching the profile below, scenarios like these fall well within the range documented in peer-reviewed safety ROI literature. If your incident rate is at or above the sector average, the numbers are meaningful. Full methodology in our Data & Methodology Note.
| Company profile | |
|---|---|
| Employees | 300 |
| Sector | Industrial manufacturing / logistics |
| Starting TRIR | ~3.0 (between BLS manufacturing 2.7 and warehousing 4.5) |
| Recordable incidents/year | ~9 |
| Total cost per incident (direct + indirect) | ~$130,000 |
| Baseline annual incident cost | ~$1.17M |
| Annual training cost saved (production time) | ~$83,000 |
Certain saving: ~$83,000/yr in reclaimed production time. This follows directly from the delivery model, whether or not your incident rate moves.
Risk-dependent return: $234,000–$705,000/yr depending on how far TRIR falls.
Strong outcome
~$790K/yr
60% incident reduction. TRIR: 3.0 → ~1.2. Consistent with best-in-class implementations in peer-reviewed safety ROI literature.5 Includes the ~$83K above.
Middle scenario
~$554K/yr
40% incident reduction. TRIR: 3.0 → ~1.8. Within the range documented across multiple peer-reviewed studies and client assessments. Includes the ~$83K above.
Conservative floor
~$319K/yr
20% incident reduction. TRIR: 3.0 → ~2.4. Even a modest, well-documented improvement in readiness produces this return. Includes the ~$83K above.
Figures derived from NSC Injury Facts 2024, BLS TRIR sector data 2024, and BLS employment cost data Q2 2025. Incident reduction percentages are consistent with peer-reviewed safety ROI literature but are not product-specific guarantees. Full documentation: Data & Methodology Note.
PRICE BENCHMARK
What does it cost to build the same capability without Action-cards®?
The example above is about what you avoid paying. This is a different question: what the system itself costs. Below is the market price of a digital safety stack covering broadly the same functions.
| Comparable digital safety stack — WITHOUT Action-cards® | Annual cost |
|---|---|
| EHS incident management platform (10 admin users) | $18,000–$36,000 |
| Safety LMS with gamification, videos & quizzes (300 users) | $30,000–$50,000 |
| Implementation & setup (amortised over 3 years) | $3,000–$7,000 |
| Manual incident reporting to insurers / police (staff time) | $5,000–$15,000 |
| Comparable stack total | ~$56,000–$108,000/yr |
Stack pricing based on publicly available EHS software market data.
If I authorised the purchase of forklifts that lost half their functional capacity every three months, how long would the board tolerate it?


From data point to decision
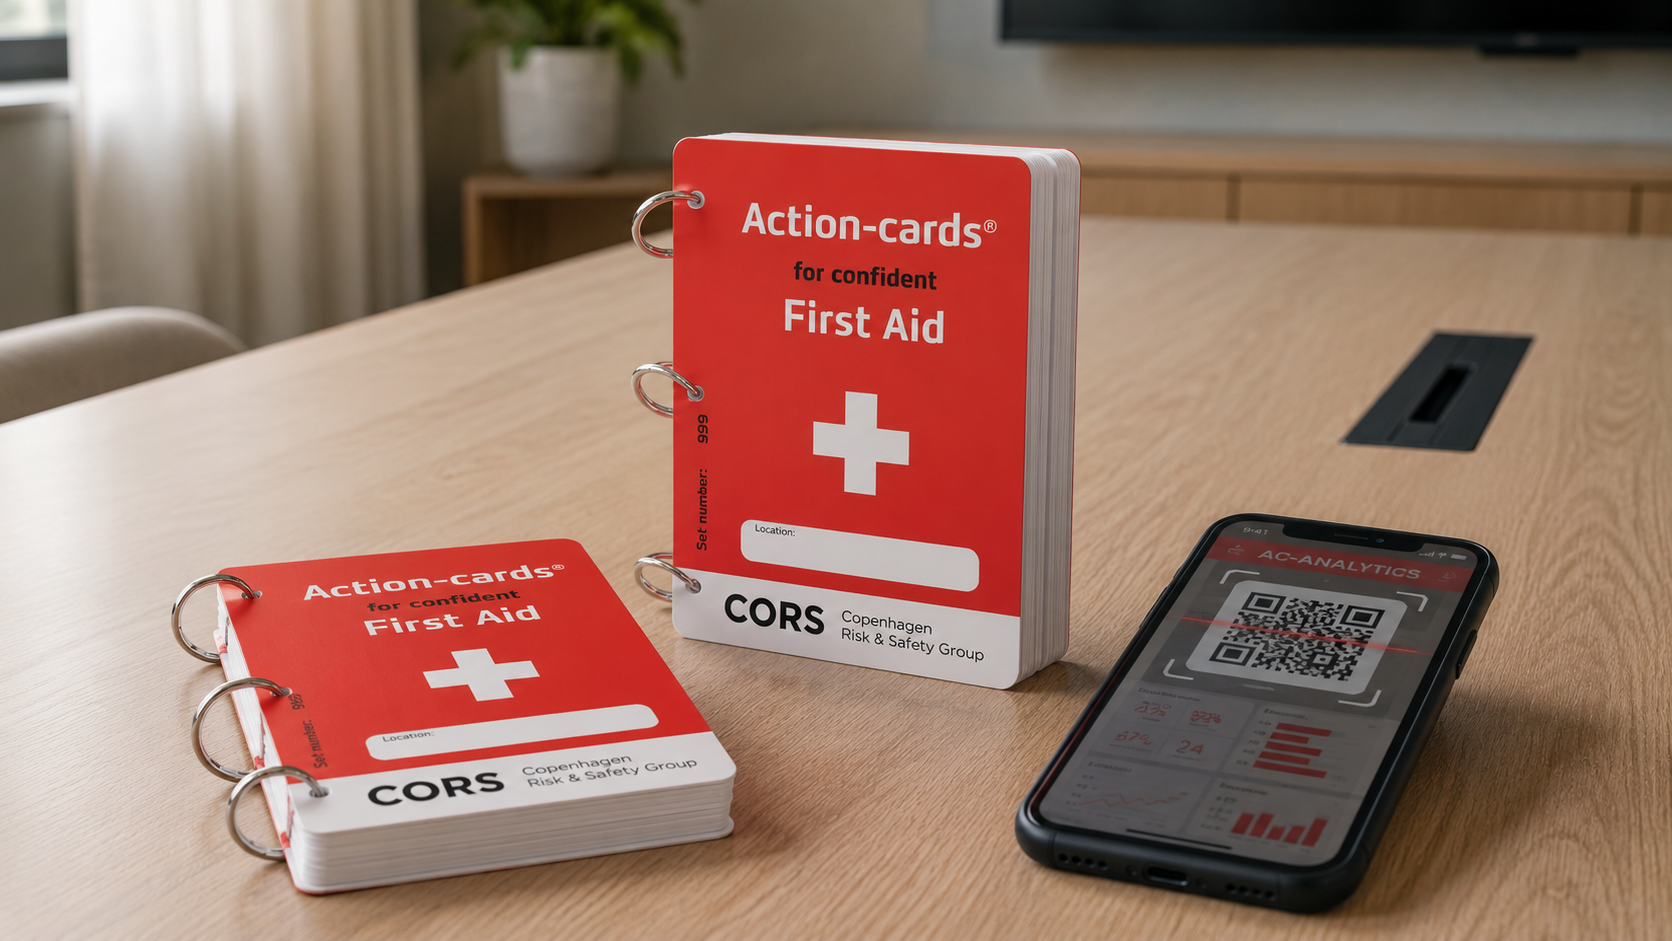
AC-Analytics turns every incident, near-miss, and micro-training session into a structured, auditable record — feeding your KPI reporting, ESG disclosures, and insurance renewal conversations.
Every QR scan logs time, user, and action automatically. Dashboards surface skill gaps, near-miss patterns, and performance trends. Automated PDF reports for insurers and police. Points and badges to motivate employees. Tailored quizzes for your specific environment.
This is how safety becomes a managed financial variable rather than a compliance cost — not by claiming it works, but by generating the data to prove it does.
The question isn't cost — it's structure
Most companies are not under-spending on safety. They are spending in the wrong structure: a large annual outlay on training that degrades within months, with no systems to reinforce it, document it, or improve on the basis of evidence.
When you can show the board that safety is a lever on insurance premiums, incident liability, and ESG-linked financing — not a fixed cost — the question shifts from “How much does this cost?” to “How quickly can we implement it?”
The question was always there in the numbers. It just took a closer look to see it. I suspect many CFOs are one conversation away from the same conclusion.

When we sit down with a CFO and walk through the actual cost structure of a single serious incident — direct costs, indirect costs, insurance consequences, productivity loss — the reaction is almost always the same: I had no idea it added up to that. The number was always there. It just wasn’t being looked at.
Important Note:
*** Based on conversations and experiences with finance leaders at industrial Action-cards® clients.
***Specific figures are representative of the pattern observed across implementations.Action-cards® are physical emergency response card sets with built-in QR incident reporting and AC-Analytics® integration.
Note:
The figure of below 50% of critical steps performed correctly without a cognitive aid is documented in independent, peer-reviewed research.6 The figure of 80–90% with cards is based on Action-cards®’ own performance data collected across customer implementations in realistic training scenarios.
Notes
1 NSC Injury Facts 2024: $48,000 average direct cost per medically consulted injury. Indirect multiplier 2–5× per NSC and OSHA SafetyPays. Conservative 2.7× applied. Full sourcing in methodology note.
2 LTIR and TRIR per OSHA standard: (incidents × 200,000) ÷ total hours worked. BLS SOII data, published January 2026, covering 2024.
3 CORS Group client risk assessment (2025). Converted from Danish Arbejdsskadestatistik 2023 using OSHA methodology. Full methodology note.
4 BLS ECEC Q2 2025: $46.30/hr total employer compensation. 6 hrs × $46.30 × 300 = $83,340. Trainer fees $40–55/person additional.
5 Verbeek et al. (2009); Fabius et al. (2013); Institute for Work & Health (2023); Thonon et al. (2023); Bautista-Bernal et al. (2024). Full citations in methodology note.
6 Anderson GS, Gaetz M, Masse J. First aid skill retention of first responders within the workplace. Scand J Trauma Resusc Emerg Med. 2011;19:11. Observational study of 257 certified first responders in industrial and service workplaces. Correct performance by step: securing the scene below 5%, correct hand placement for abdominal thrusts 33%, correct hand placement for compressions 45%, activating EMS 52%, compressions to trained standard 31%.
7 Smith KK et al. Evaluation of staff’s retention of ACLS and BLS skills. Resuscitation. 2008. See also Arriaga AF et al., Simulation-Based Trial of Surgical-Crisis Checklists, N Engl J Med 2013;368:246-53, documenting that cognitive aids remove roughly 75% of omission errors during crises.